Every marketing agency talks about conversion rate optimization. Few of them start with the right question: what is your actual conversion rate?
Not the number Google Analytics shows you. Not the number your SEO company puts in a monthly report. Your real conversion rate — the one that reflects how many genuine, high-intent customers your website produces from the traffic that actually matters.
Most businesses are optimizing based on a number that's wrong. Here's why, and how we fix it.
The Standard Formula Is Broken
The formula every marketing textbook teaches is simple:
Conversion Rate = Total Leads ÷ Total Traffic
This formula has two fundamental problems.
Problem 1: Not all traffic is relevant
If your business serves Denver, Colorado, and 40% of your website traffic comes from India, Russia, or bots crawling your site — that traffic will never become a customer. But Google Analytics counts it all the same. It inflates your denominator, which deflates your conversion rate, which makes your site look worse than it actually is.
The traffic that matters for a local business is local traffic — visitors from your service area who could realistically pick up the phone and hire you.
Problem 2: Not all "leads" are real leads
Google Analytics tracks "events" — form submissions, phone clicks, chat interactions. CallRail tracks phone calls. But neither tool distinguishes between:
- A homeowner calling for a quote (a true lead)
- A marketing company pitching their services (not a lead)
- A robocall or spam caller (not a lead)
- A wrong number or hangup (not a lead)
- A current customer calling about an existing job (not a new lead)
- A Google Ads rep calling to sell you advertising (not a lead)
Every one of these gets counted as a "conversion event" in standard analytics. Your SEO company reports them all as leads. Your conversion rate is artificially inflated — and your actual cost-per-lead is much higher than you think.
[!WARNING] "Events" are not "conversions." Every analytics tool counts interactions. None of them verify whether those interactions came from a real potential customer. Don't be fooled by event counts in your dashboard.
True Conversion Rate — How Despora Solves Both Problems
Despora.ai is our proprietary AI platform that calculates what we call the True Conversion Rate. It solves both problems simultaneously:
1. Geographic filtering — We configure Despora with your exact service area. It separates local traffic (visitors from your region) from irrelevant traffic (international visitors, bots, out-of-area browsers). Only local traffic counts.
2. Lead verification — Every incoming lead — phone call, form submission, SMS — is recorded, transcribed, and analyzed by AI. Despora categorizes each one as:
- Qualified lead — high-intent buyer in your service area
- Returning customer — existing client, not a new lead
- Spam/robocall — filtered out automatically
- Marketer/solicitor — filtered out
- Hangup/empty form — filtered out
Only verified, high-intent leads count in the numerator.
The result is a fundamentally different formula:
True Conversion Rate = True Leads ÷ Local Traffic
The Difference Is Massive
What other agencies report
One of our clients is a commercial kitchen hood construction company in Denver. A typical marketing company working with this client would pull numbers from Google Analytics and CallRail, count every event — every phone call, every form submission, every chat interaction — as a "lead," and report:
69 leads ÷ 1,219 total sessions = 5.66%
They'd put that in a monthly report and call it a good conversion rate. But of those 69 "leads," many were spam calls, marketing solicitors, existing customers, and hangups. The number is meaningless.
What Despora shows — True Total Traffic Conversion Rate
Despora analyzes every single lead. Of those 69 interactions, only 32 were verified, high-intent leads — real potential customers who wanted to hire this company. The rest were junk.
32 approved leads ÷ 1,219 total sessions = 2.63%
Even this "total traffic" number is more real than what other agencies calculate, because the numerator only includes verified leads — not spam, not solicitors, not existing customers.
What Despora shows — True Local Traffic Conversion Rate
Now filter the denominator to only local traffic — visitors from the Denver metro area who could actually become customers. Of those 32 approved leads, 18 came from local visitors:
18 local approved leads ÷ 163 local sessions = 11.04%
Three numbers. Same website. Same month.
| Who's Calculating | Formula | Result |
|---|---|---|
| Other agencies | All events ÷ All traffic | 5.66% |
| Despora (total) | True leads ÷ All traffic | 2.63% |
| Despora (local) | Local true leads ÷ Local traffic | 11.04% |
The agency says 5.66% — sounds decent. Despora says the real total is 2.63% — less than half. But zoom into local traffic, and the site converts at 11.04% — meaning the website is actually performing exceptionally well for the audience that matters.
[!IMPORTANT] Every number tells a different story. Only the true numbers lead to the right decisions.
Why Most Marketing Companies Ignore Real CRO
Here's something most agencies won't admit: they don't pay attention to real conversion rates because they know their numbers aren't real.
When your "conversion rate" is built on inflated lead counts and irrelevant traffic, any optimization you do is guesswork. You can't A/B test your way to improvement if the baseline measurement is wrong. You can't attribute changes to specific optimizations if the data is contaminated with spam and out-of-area visitors.
So most agencies skip CRO entirely. They focus on traffic volume — "we got you 20% more visitors this month" — because traffic is easy to measure and hard to argue with. But traffic without conversions is just a vanity metric.
This is exactly why we built Despora. When you can see the true conversion rate — broken down by page, by traffic source, by region — conversion rate optimization stops being theoretical and becomes measurable. You make a change, you watch the number move (or not), and you know whether it worked.
Regardless of which numbers you're looking at in Despora, you're looking at true values — not artificial numbers. That's the difference between guessing and optimizing.
Per-Page Conversion Rate
Despora doesn't just calculate your site-wide conversion rate. It breaks it down per page.
This is critical because not every page on your website performs the same way. Your homepage might convert at 12%. Your "About Us" page might convert at 0.5%. A specific service page might convert at 15%.
Knowing which pages convert and which don't tells you:
- Where to invest more content and SEO effort
- Which pages need UX improvements
- Which pages are attracting the wrong audience
- Where to place calls-to-action for maximum impact
Without per-page conversion data based on true leads, you're guessing.
Mobile vs. Desktop Breakdown
Despora also breaks down conversion rate by device type — mobile vs. desktop. This matters more than most businesses realize.
Using the same Hood Builder client, here's the local conversion rate split by device:
Desktop — Local Traffic:
3.10% — 4 leads from 129 desktop sessions, 66.7% approval rate
Mobile — Local Traffic:
9.09% — 3 leads from 33 mobile sessions, 80.0% approval rate
Mobile converts at nearly 3x the rate of desktop for this client. And the approval rate is higher on mobile too — 80% vs. 66.7% — meaning mobile visitors are more likely to be genuine, high-intent leads.
This tells us something critical about this business: people who need commercial kitchen hood work are often on a job site, searching from their phone. They find the site, they call immediately. Desktop visitors are more likely browsing, comparing, or researching — not ready to act.
Why this matters for optimization
If you don't know your mobile vs. desktop conversion split, you might make the wrong optimization decisions:
- If your site converts well on mobile but poorly on desktop, you might need better desktop CTAs or content layout — not a complete redesign
- If desktop converts well but mobile doesn't, your mobile UX likely has issues — slow load times, hard-to-tap buttons, or forms that are painful to fill out on a small screen
- If you're spending money on desktop-heavy ad campaigns but your conversions come from mobile organic search, you're wasting budget
Despora gives you this data automatically. No guesswork, no assumptions — just numbers that tell you exactly where to focus.
What Despora Shows You
For every client, Despora provides:
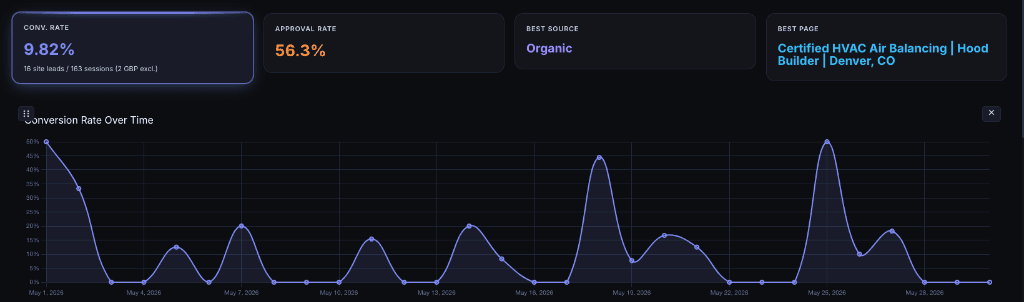
| Metric | What It Means |
|---|---|
| Conv. Rate | True leads ÷ total sessions |
| Local Conv. Rate | True leads ÷ local sessions |
| Approval Rate | Percentage of all leads that are verified as true leads |
| Best Source | Which traffic source (organic, direct, referral) produces the most leads |
| Best Page | Which page on your site generates the most conversions |
| Conversion Over Time | Daily/weekly trend showing how conversion rate changes |
All of this data is available in real-time. You see it. We see it. There's no guessing, no inflated reports, no vanity metrics.
Why This Matters Before You Optimize
Here's the mistake most businesses make: they hire someone to "improve conversion rate" without knowing what the current rate actually is.
If your analytics says you convert at 2% and you spend $10,000 redesigning your site to get to 3%, you might celebrate a 50% improvement. But if your true conversion rate was already 9% and the redesign didn't change local visitor behavior at all — you wasted $10,000 chasing a phantom number.
Step one is always measurement. You cannot improve what you cannot accurately measure.
Once you have your true conversion rate from Despora, then — and only then — does it make sense to start optimizing. And when you do optimize, you'll know exactly which pages to focus on, which traffic sources matter, and whether your changes actually moved the needle.
Ready to Optimize? Start Here
Once you have accurate conversion data, there are five proven strategies that improve conversion rate for local businesses. We've tested all of them across dozens of client sites, and the results are measurable in Despora within weeks.
Read the full guide: How to Improve Your Site's Conversion Rate →
The guide covers:
- Site speed (the single biggest factor)
- Content relevance and bait-and-switch avoidance
- Calls-to-action placement
- Site structure and UX
- Clean, modern design
Every recommendation is backed by data — both industry research and our own client results.